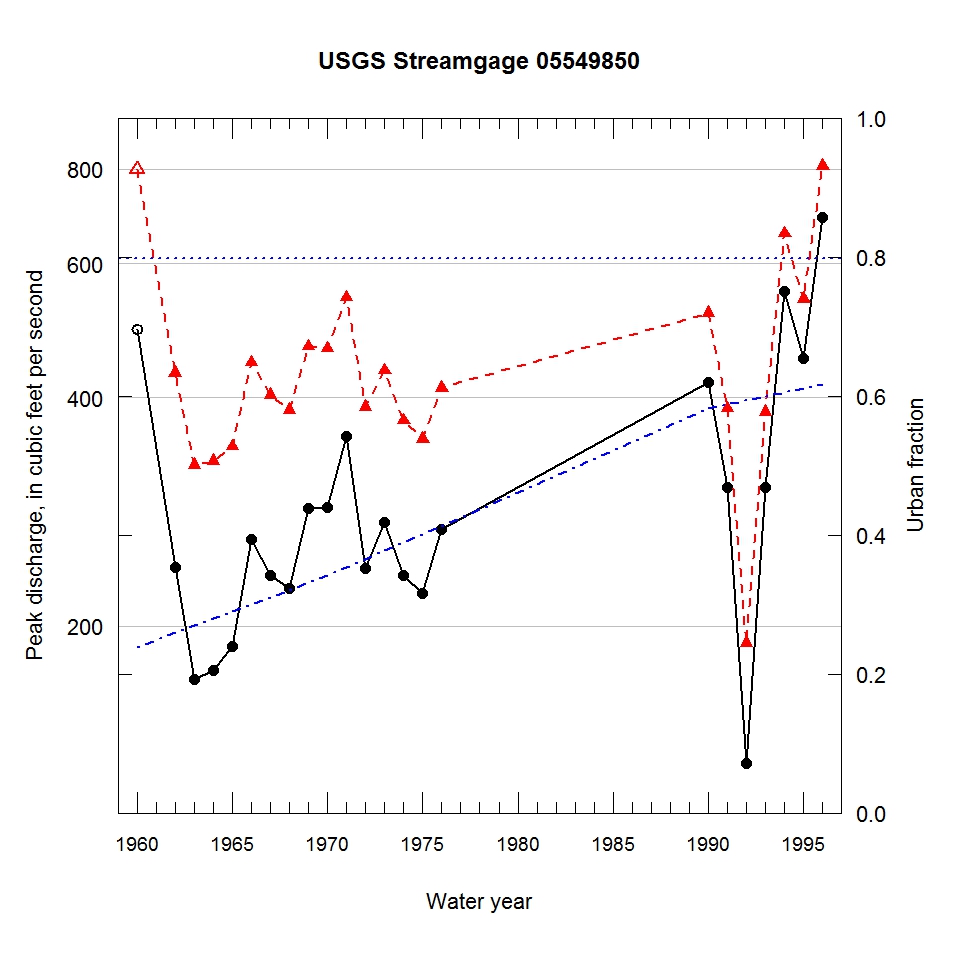
Observed and urbanization-adjusted annual maximum peak discharge and associated urban fraction and precipitation values at USGS streamgage:
05549850 FLINT CREEK NEAR FOX RIVER GROVE, IL


| Water year | Segment | Discharge code | Cumulative reservoir storage (acre-feet) | Urban fraction | Precipitation (inches) | Observed peak discharge (ft3/s) | Adjusted peak discharge (ft3/s) | Exceedance probability |
| 1960 | 1 | 7 | 282 | 0.239 | 0.481 | 492 | 799 | 0.061 |
| 1962 | 1 | -- | 282 | 0.259 | 0.266 | 239 | 431 | 0.436 |
| 1963 | 1 | -- | 282 | 0.270 | 0.288 | 170 | 326 | 0.691 |
| 1964 | 1 | -- | 282 | 0.280 | 3.171 | 175 | 330 | 0.681 |
| 1965 | 1 | -- | 282 | 0.290 | 0.021 | 188 | 345 | 0.643 |
| 1966 | 1 | -- | 282 | 0.300 | 0.532 | 260 | 445 | 0.405 |
| 1967 | 1 | -- | 282 | 0.311 | 1.244 | 233 | 403 | 0.499 |
| 1968 | 1 | -- | 282 | 0.321 | 3.202 | 224 | 385 | 0.540 |
| 1969 | 1 | -- | 282 | 0.331 | 2.094 | 286 | 467 | 0.358 |
| 1970 | 1 | -- | 282 | 0.341 | 2.425 | 287 | 464 | 0.364 |
| 1971 | 1 | -- | 282 | 0.353 | 0.395 | 356 | 542 | 0.220 |
| 1972 | 1 | -- | 282 | 0.365 | 0.704 | 238 | 389 | 0.532 |
| 1973 | 1 | -- | 282 | 0.377 | 1.808 | 274 | 434 | 0.430 |
| 1974 | 1 | -- | 282 | 0.389 | 1.056 | 233 | 373 | 0.572 |
| 1975 | 1 | -- | 282 | 0.401 | 1.513 | 221 | 353 | 0.622 |
| 1976 | 1 | -- | 282 | 0.413 | 1.682 | 268 | 412 | 0.479 |
| 1990 | 1 | -- | 282 | 0.582 | 2.206 | 419 | 517 | 0.257 |
| 1991 | 1 | -- | 282 | 0.588 | 0.295 | 305 | 387 | 0.537 |
| 1992 | 1 | E | 282 | 0.594 | 0.447 | 132 | 190 | 0.947 |
| 1993 | 1 | -- | 282 | 0.599 | 0.847 | 305 | 383 | 0.548 |
| 1994 | 1 | E | 282 | 0.605 | 0.608 | 552 | 658 | 0.124 |
| 1995 | 1 | -- | 282 | 0.611 | 1.857 | 451 | 539 | 0.226 |
| 1996 | 1 | -- | 282 | 0.616 | 1.981 | 690 | 807 | 0.057 |

